




Creative Audits & Reporting

Creative audits and reporting that turn performance data into better briefs

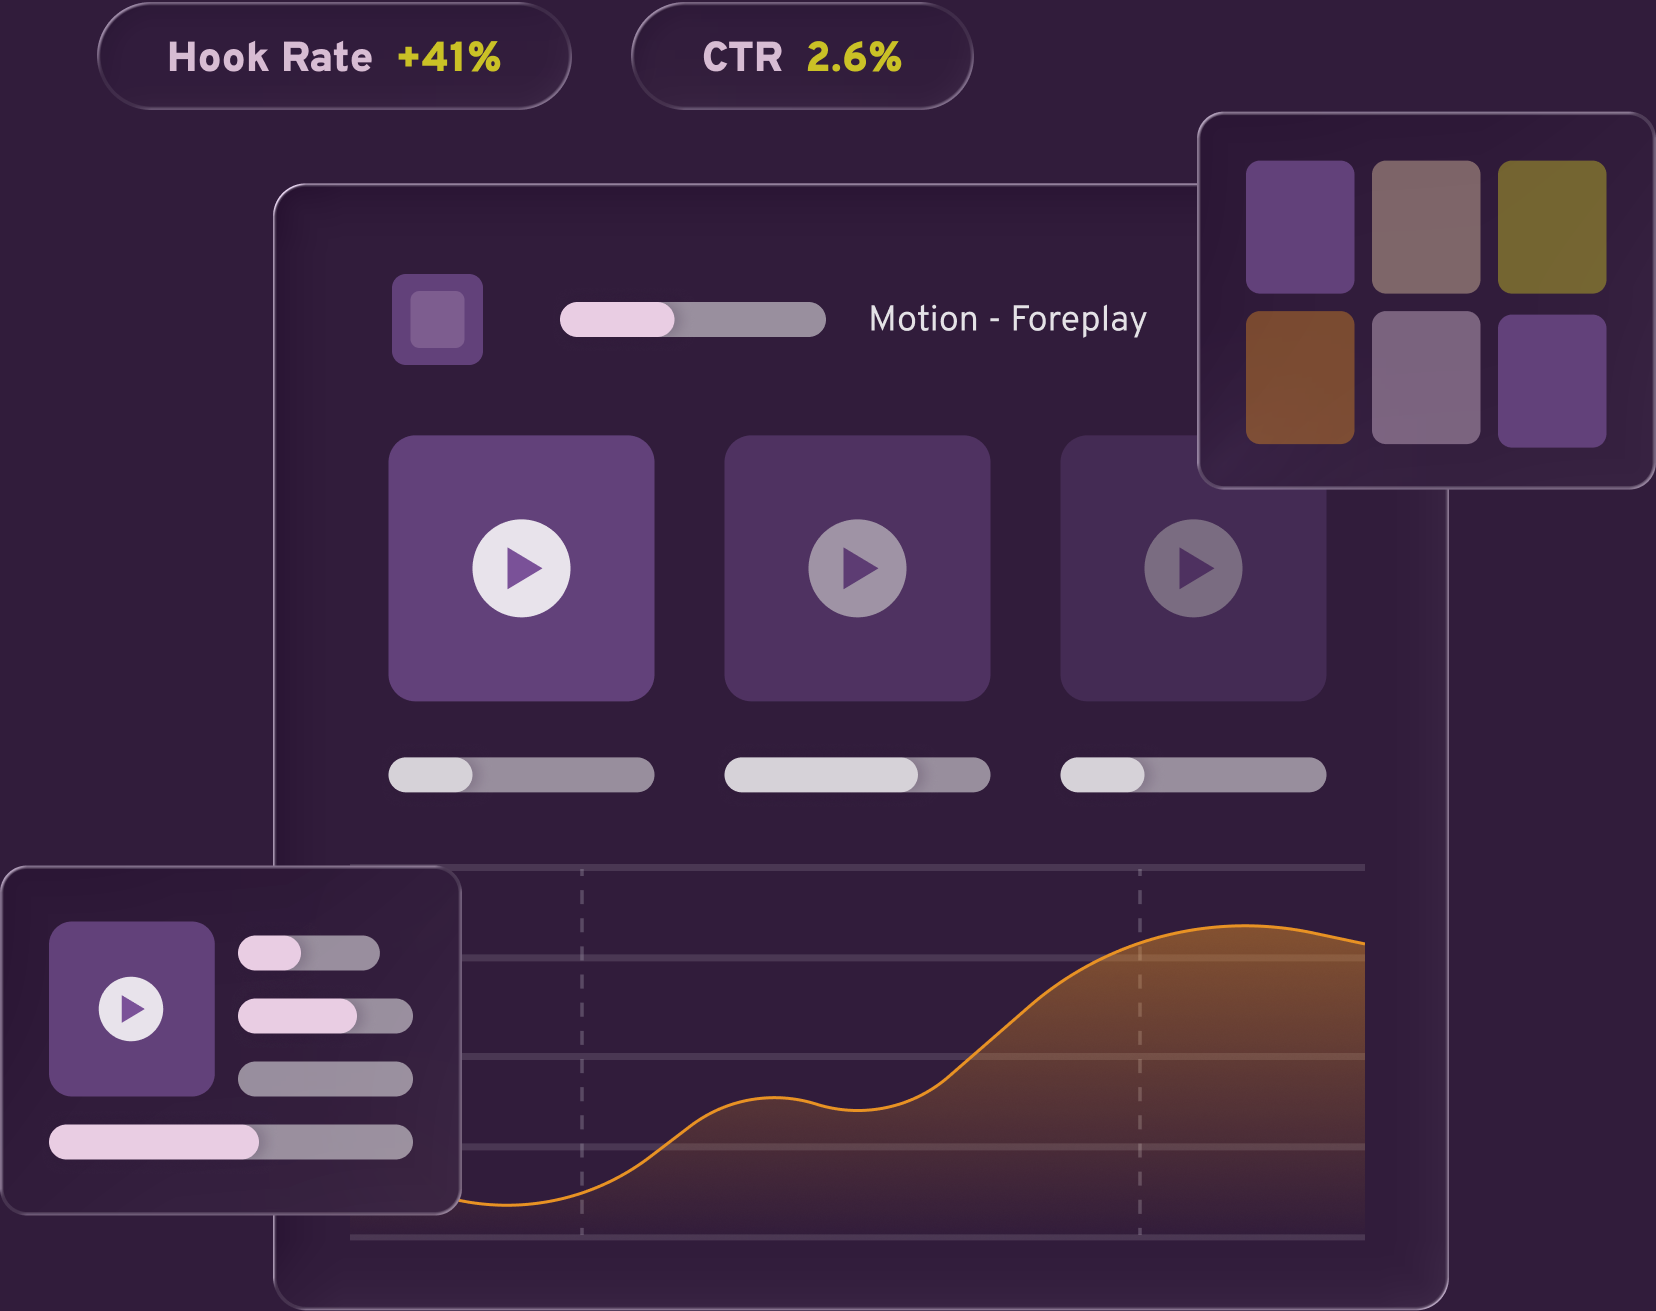
Creative audits and reporting graphic with creative thumbnails, a performance trend and hook rate and CTR metrics
Creative audits that go beyond CTR and ROAS and turn performance data into briefs your design team can act on.
Creative audits and reporting graphic with creative thumbnails, a performance trend and hook rate and CTR metrics
We help companies build sustainable growth programs, powered by the right platforms and tools.

Where creative reporting goes wrong

Most creative reporting stops at CTR and ROAS. Neither tells you why an asset is performing, which element to iterate on, or what to brief next. They tell you what happened, not what to do about it.

Creative decisions get made too fast or too slow. Assets get pulled after two days of low engagement before they've generated enough data to be meaningful, or kept running well past the point of fatigue because nobody has a systematic rotation framework in place.

Reporting and strategy get treated as separate workstreams. The analyst produces numbers, the creative team produces concepts, and nobody connects what the data learned to what gets briefed next. The cycle never compounds.

Work With Us

Our approach to creative audits and reporting

Every program runs on a single integrated system where measurement informs creative, creative informs media, and media decisions are validated by data. The result is a cycle of learning that compounds over time, not a set of disconnected tactics that reset every quarter.

Creative frameworks

Creative decision frameworks built around if-then logic rather than hard rules. Low hook rate does not automatically mean change the hook. Strong down-funnel performance from a low-CTR asset gets protected rather than pulled. Spend thresholds are enforced before any creative decision is made so assets are evaluated only after reaching statistically meaningful data.

Attention metrics

Attention metrics used as diagnostic tools. Thumb hook rate, stop rate, hold rate, and video completion rate identify where in the creative the audience drops off and inform specific iterations rather than wholesale replacement. All metrics are treated as proxies, not outcomes, with relationships between engagement signals and business outcomes made explicit.

Audit outputs

Audit outputs delivered as briefs with specific creative directions and testable hypotheses that a design team can execute against immediately. Reporting cadence matched to the creative cycle: weekly signals for in-flight decisions, monthly reporting for creative strategy sessions, and quarterly reviews for broader roadmap and audience evolution.
Work With Us

How we've helped brands like yours

From proving which channels really drive sales to creative that beats in-house ads, here's what we delivered.

Thrive empowers companies big and small to build sustainable growth programs.

uber
tempurpedic
masterclass
square
asana

“Thrive worked hand-in-hand with our in-house team to craft a bold strategic vision for our digital marketing program, and then ensured that every detail and dollar was accounted for in our campaigns. Asana's acquisition program is more effective thanks to our partnership and co-creation with Thrive.”

smith

“Thrive has been a key partner for helping Smith transform from a traditional wholesale business to a digitally minded consumer-first brand. Helping us acquire new customers for all our channels. They move fast and are extremely proactive”

snapchat
classpass
earnest

“The team at Thrive Digital is great to work with. They are diligent, strategic and deeply focused on the details. Thrive is a rare breed among digital marketing agencies.”

arcteryx
lululemon
coinbase
gofundme
A systematic evaluation of every in-market creative asset across performance metrics, attention signals, and business outcome alignment, combined with a competitive landscape review of what's working within and outside the vertical. The output is a structured brief: what to iterate on, what to replace, and what the data says to test next.
Explore creative strategy
Hook rate, hold rate, video completion rate, CTR, CPC, CPA, and downstream conversion rates. None of these in isolation. The relationships between them matter. Strong hook rate with poor down-funnel performance signals a creative attracting the wrong audience. Low CTR with strong CPA signals a highly qualified one. Context is everything.
Explore analytics and attribution
Attention metrics measure how audiences engage with creative before any click occurs. Thumb stop rate, hold rate, and video completion are valuable diagnostic tools. They identify where in the creative the audience drops off and inform specific iterations. They shouldn't be used as standalone performance scores or treated as equivalent to business outcomes.
Explore performance creative
When performance signals are strong but a specific element is limiting reach, iterate on that element. When performance has plateaued across multiple iterations or a new audience requires fundamentally different messaging, start fresh. The decision comes from what the data shows about why performance is where it is.
Explore creative strategy
Creative reporting identifies which assets are driving performance and why, and that analysis feeds back into the media plan through format weighting, channel prioritization, and audience segmentation decisions. High-performing creative informs where more budget should run. Underperforming assets still receiving budget drag on the whole program.
Explore media buying
Weekly for in-flight signals like frequency, engagement trends, and early fatigue indicators. Monthly for strategic decisions around what to scale, cut, and brief next. Quarterly for audience evolution and broader roadmap review.
Explore performance creative